Profitability Ratio Analysis
Profitability ratio is a financial metrics that is used to measure profit generation and management. Business Owners, Managers, Investors and Financial lenders use it to assess a business ability to generate earnings relative to its associated expenses, using a specific point in time. The following metrics is used commonly to measure and manage a business:
Net Profit Margin
Financial metric to measure a company's net profit, the percentage difference between net income and net sales.
In other words, the amount of money left after deducting all its expenses (cost of goods, operational expenses, interest cost, depreciation cost, taxes and if any dividend paid).
Formula:
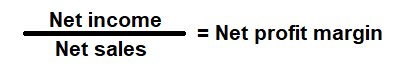
How to use this equation?
This is an income statement component; the values are commonly stated against net income and net sales (earnings). To use this ratio, divide the net income with net sales.Net Sales:
Total sales less returns and bad debts.
Net Income:
Profit left over after deducting all its expenses (cost of goods, operational expenses, interest cost, depreciation cost, taxes and if any dividend paid).
Example:
Net profit margin for a company with a net sales income of $100,000 and net income of $10,000 is 10%. It means the company has a net income of $0.10 for each dollar it generated, or we can say that, company converted 10% of its sales into profits.
To learn more, try our - Net profit margin calculator
Gross Profit Margin
Financial metric used to measure a company's gross margin or profit, the percentage difference between of gross profit and net sales.
In other words, the amount of money left over from sales after deducting the cost of goods sold (Direct expenses).
Formula:
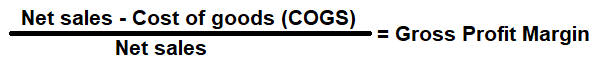
How to use this equation?
This is an Income statement component; the values are commonly stated against net sales (earnings) and cost of goods (COGS). To use this ratio, subtract cost of goods from net sales to arrive at the gross margin. Then divide gross margin by net sales.Net Sales:
Total sales less returns and bad debts.
Cost of Goods:
Cost of goods sold (COGS) is total cost to produce goods and services such as cost of materials, wages and other expenses related to producing a goods and service.
Example:
Gross profit margin for a company with a net sales income of $100,000 and Cost of goods sold (COGS) of $30,000 is 70%. It means the company profits $0.50 for each dollar of it generated, or we can say that, company has 70% of its sales income to cover its operating expenses.
To learn more, try our - Gross profit margin calculator
Return on Equity (ROE)
Financial metric used to measure, how much value the company is making for the shareholders equity investments.
Regardless of whether a company has only common shares or also has preferred shares, this ratio takes all equity into account.
A high ROE could mean a company is more successful in generating profit internally. However, it doesn't fully show the risk
associated with that return, it may rely heavily on debt to generate a higher net profit which in return help the company return
a ROE higher.
Formula:
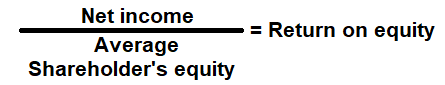
How to use this equation?
The values for net income can be obtained from income statement and total shareholder's equity value from the balance sheet. To use this ratio, divide the net income with average total shareholder's equity.Note:
Average shareholder's equity: Add the total shareholder's equity from current year and the previous year, and then divide the sum by 2.
Net Income after tax:
Profit left over after deducting all its expenses (cost of goods, operational expenses, interest cost, depreciation cost, taxes and if any dividend paid).
Total Shareholder's Equity:
Total shareholder's equity is the value left in the company after subtracting total liabilities from total assets.
Example:
Return on equity ratio for a company with net income of $60,000 and total shareholder’s equity of $600,000 is 10%. It means that, a company yields a return of $0.10 per dollar for its shareholder's equity investment.
To learn more, try our - Return on total equity calculator
Return on Capital Employed (ROCE)
Financial metric used to measure, how well a company is using its capital to generate profits.
In other words, return on capital employed shows investors how many dollars in profits each dollar of capital employed generates.
ROCE is considered one of the best profitability ratios and is commonly used by investors to determine whether a company is
suitable to invest or not.
Formula:
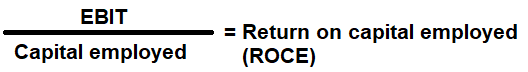
How to use this equation?
The values for net operating profit or earnings before interest and tax (EBIT) can be obtained from income statement and to calculate capital employed - obtain the values of total assets and current liabilities from the balance sheet. To use this ratio, divide earnings before interest and tax (EBIT) by the capital employed.Earnings before interest and tax (EBIT):
Net income or profit before deducting all its interest & taxes.
Capital Employed:
It is the total amount of equity invested in a company. It is the sum of shareholders' equity and current liabilities. It can be simplified as total assets minus current liabilities.
Example:
Return on capital employed ratio for a company with a reported EBIT of $100,000; $200,000 of total assets and $50,000 of current liabilities is 0.6666 or 66.66%. It means that, a company yields a return of $0.66 per dollar for its capital employed.
To learn more, try our - Return on capital employed calculator
Return on Assets (ROA)
Financial metric used to measure, how effectively a company is using its assets to generate income.
In other words, return on assets helps determine whether a company can use its assets to develop profitability, not just increasing sales.
Formula:
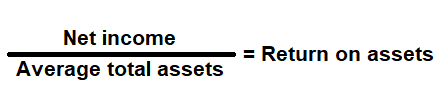
How to use this equation?
The values for net income can be obtained from income statement and total assets value from the balance sheet. To use this ratio, divide net income with average total assets.Note:
Average total assets: Add current year and previous year total assets value, and then divide that value by 2.
Net Income:
Profit left over after deducting all its expenses (cost of goods, operational expenses, interest cost, depreciation cost, taxes and if any dividend paid).
Total Assets:
Total assets are the sum of all current and noncurrent assets that a company owns.
Example:
Return on assets ratio for a company with net income of $60,000 and total assets of $300,000 is 20%. It means, every dollar that was invested in assets during the year produced $0.20 of net income.
To learn more, try our - Return on assets calculator
Return on Investment (ROI)
When a company raises funds , either by incurring debt or
by selling equity, it invests those funds to purchase assets or fund operating expense. Return on investment (ROI) is
used to measure; how well the company is using those investments to generate profits.
In other words, return on investment helps determine whether it was worth the company's
time and efforts to raise those funds.
Formula:
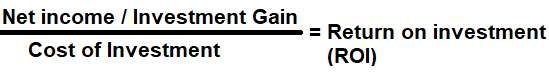
How to use this equation?
It is calculated by dividing net income by the cost of investment. The values for net income can be obtained from income statement, total shareholder's equity and long-term liabilities from balance sheet. To use this ratio, divide net income by cost of investment.Note:
Cost of Investment: Add current year and previous year long-term liabilities and total shareholder's equity value, and then divide that value by 2 to get the average cost of investment.
Net Income:
Profit left over after deducting all its expenses (cost of goods, operational expenses, interest cost, depreciation cost, taxes and if any dividend paid).
Long-term Liabilities:
Non-current liabilities are financial obligations owed by a company that is not due within a year. Long-term liabilities mostly consist of notes payable, bonds payable, mortgages and leases, but can include other non-immediate expenses such as pension obligations.
Total Shareholder's Equity:
Total shareholder's equity is the value left in the company after subtracting total liabilities from total assets.
Example:
A company with net income of $100,000 and average cost of investment of $300,000 is 33%. Return on investment is $0.33 for each dollar of investment. In case, an investor buys $100,000 worth of market securities at the beginning of year one and sells it at end of year two for $120,000.00. The net gain from such investment would be $20,000 and return of investment is 20% or $0.20 for each dollar of investment.