Financial Leverage Ratio Analysis
Financial Leverage ratio is a financial metrics that is used to measure, how effectively a company can manage its debt to generate income.
In other words, the financial leverage ratios measure the overall debt load of a company and compare it with the assets or equity.
A company capital structure can be a mix of common equity, preferred equity, long term debt and short-term debt.
There are several different leverage ratios that may be considered by market analysts, investors, or lenders.
The following metrics is used commonly to measure how much capital comes in the form of debt and equity, assess the ability of a company
to repay its debt obligations with its assets:
Altman Z-Score Ratio
The Altman-Z Score estimates a companys likelihood of entering bankruptcy within two years by combining five financial ratios from its balance sheet and income statement into a single indicator of financial stability.
Developed by Edward Altman in 1968, it remains widely used to assess credit risk and overall financial health.
What the ALTMAN-Z Score represents?
The metric blends measures of liquidity, profitability, leverage, solvency, and operational efficiency to create a composite view of whether a firm is financially sound or trending toward distress.
Because it integrates multiple ratios rather than evaluating them individually, it offers a more holistic assessment of bankruptcy risk.
Why it matters
- It helps investors, lenders, and analysts identify early warning signs of financial trouble.
- It is especially useful for comparing companies within similar industries or evaluating creditworthiness.
- Different versions of the model exist for public manufacturers, private companies, and non‑manufacturers, making it adaptable across business types.
Formula:
How to use this equation?
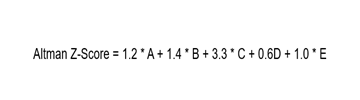
Altman Z-Score = 1.2A + 1.4B + 3.3C + 0.6D + 1.0EWhere:
A = working capital / total assets
B = retained earnings / total assets
C = earnings before interest and tax / total assets
D = market value of equity / total liabilities
E = sales / total assets
Example:
If company has following values (In Thousands)
Working capital: $16,400
Retained earnings: $8,148
EBIT: $7500
Total assets: $26,404
Market value of equity: $17,797
Total liabilities: $10,004
Sales: $39,895
Based on the above financial data, a company Altman-Z score of 4.86, it is financially strong and the likelyhood of bankruptcy is low.
To learn more, try our - ALTMAN Z-Score ratio calculator
Debt to Equity (D/E) Ratio
Financial metric used to measure the riskiness of a company's financial structure - total debt and total equity proportion of a company's expressed in terms of percentage.
In other words, for every dollar of equity, how much debt a company is carrying to fund its assets to generate income.
Generally, a high debt-to-equity ratio can mean that the, company is in a financial distress and unable to pay its debt.
It can be looked differently based past performance, Industry, Sectors and another company.
Some of the common reason for a high debt to equity ratio can be: if a company has a low times interest earned,
then it may probably be that, the company is too reliant on funding operation with debt and will have a
hard time paying its interest and if a company has a low times interest earned, then it may probably be that,
the company is not generating enough cash to satisfy its debt obligation.
This could mean that investors don’t want to fund the business operations because the company isn’t performing well.
Lack of performance might also be the reason why the company is seeking out extra debt financing.
However, a low debt-to-equity ratio is commonly seen among smaller businesses as the shy away from debt or we can say
that, the company is not fully utilizing its financial leverage - not seeking external finance and too reliant on internal funds
this is common with companies that is not growing aggressively or too cautious.
Formula:
How to use this equation?
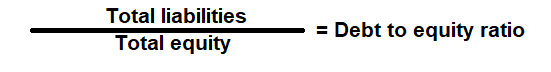
This is a balance sheet component; the values are commonly stated against Total Liabilities and Total Equity. To use this ratio, divide the total liabilities by total equity.Total Liabilities (Debt):
Total Liabilities is the source of the funds such as short term and long-term external borrowing that is mainly used to fund its asset purchase.
Total Shareholder's Equity (Equity):
Total equity is the is the value left in the company after subtracting total liabilities from total assets.
Example:
Debt to equity (D/E) ratio for a company with a total liability of $360,000 and total equity of $720,000 is 0.5:1. It means that, the assets of the company are funded 2-to-1 by investors to creditors. In other words, the company has a $0.50 of debt for every dollar of equity.
To learn more, try our - Debt-to-equity ratio calculator
Debt Ratio
Financial metric used to compare debt (total liabilities) to its total assets.
It shows the proportion of a company's assets that is financed by debt.
In other words, if company's assets must be liquidated this ratio helps to determine, what percentage of assets has to be sold to pay off debt in future.
Lenders like to know a company's debt ratio because they want to be reassured that they'll get their money back-even if the company goes out of business.
It also helps company to determine whether they're at risk of defaulting on the debt?
Generally, a debt ratio greater than 1 means the company has more debt than the company is worth, or we can say
that, the company may be putting itself at a risk on its loan if interest rates were to rise suddenly.
However, a low debt ratio of less than 1 means the company has more assets than the debt it owes, or we can say that,
a greater portion of company's assets is funded by equity.
Formula:
How to use this equation?
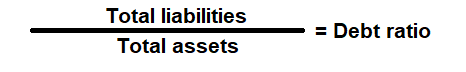
This is a balance sheet component; the values are commonly stated against Total Liabilities and Total Assets. To use this ratio, divide the total liabilities by total assets.Total Liabilities (Debt):
Total Liabilities is the source of the funds such as short term and long-term external borrowing that is mainly used to fund its asset purchase.
Total Assets:
Total assets are the sum of all current and noncurrent assets that a company owns.
Example:
Debt ratio for a company with total liabilities of $300,000 and total assets of $500,000 is 0.6:1. It means that, 60% of its assets are financed by debt.
To learn more, try our - Debt ratio calculator
Debt Service Coverage Ratio
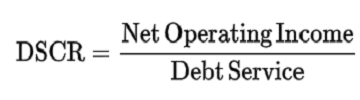
The debt‑service coverage ratio (DSCR) measures how well a company can generate enough operating income to cover the principal and interest it must pay on its debt.
It is especially important for companies with heavy borrowing because it shows whether their cash flow is sufficient to meet required loan payments.
Lenders and stakeholders closely monitor DSCR, and loan agreements often include minimum DSCR requirements to ensure the borrower maintains adequate financial strength.
Why DSCR matters?
- Signals financial stability: A higher DSCR indicates stronger ability to meet debt obligations without strain.
- Critical for leveraged companies: Firms with significant debt rely on DSCR to demonstrate they can sustain repayment.
- Used in loan agreements: Banks often set DSCR thresholds as part of covenants to manage lending risk.
How DSCR is interpreted
- DSCR > 1.0 - The company generates more cash than needed to cover debt payments.
- DSCR = 1.0 - Cash flow just covers debt obligations, leaving no buffer.
- DSCR < 1.0 - The company cannot fully cover its debt service from operating income, signaling financial stress.
Formula:
How to use this equation?
This is a balance sheet component; the values are commonly stated against Total Liabilities and Total Assets. To use this ratio, divide the total liabilities by total assets.Total Liabilities (Debt):
Total Liabilities is the source of the funds such as short term and long-term external borrowing that is mainly used to fund its asset purchase.
Total Assets:
Total assets are the sum of all current and noncurrent assets that a company owns.
Example:
The companys Debt Service Coverage Ratio (DSCR), based on a net operating income (EBIT) of $387,220 and annual debt obligations of $148,000, is 2.62x, indicating that operating income covers debt payments more than twice over. When factoring in an additional $50,000 in capital expenditures (CAPEX), the adjusted DSCR decreases to 2.28x, reflecting the reduced cash available for servicing debt after necessary reinvestments.
To learn more, try our - Debt ratio calculator
Equity Ratio
Financial metric used to compare equity (total shareholder's equity) to its total assets.
It shows the proportion of a company's assets that is financed by equity. It is also called "Equity multiplier".
Equity ratio of 1 means that all the company's assets are funded through equity and the company has no debt.
Higher equity ratios that are closer to 1 considered to be favorable for a company. It shows that investors are willing to finance the company assets
which in return can help bring new investors to finance the company. Most case, equity cost is going to be much lower when compare to raising debt.
However, a low equity ratio indicates that a large portion of its assets is financed through debt. This may be caution for a new investor as well existing equity shareholder's,
if interest rate goes higher or if there is economic downturn then it will be difficult for the company to service its debt.
Formula:
How to use this equation?
This is a balance sheet component; the values are commonly stated against Total Equity and Total Assets. To use this ratio, divide the total equity by total assets.Total Shareholder's Equity (Equity):
Total equity is the is the value left in the company after subtracting total liabilities from total assets.
Total Assets:
Total assets are the sum of all current and noncurrent assets that a company owns.
Example:
Equity ratio for a company with a total equity of $150,000 and total assets of $200,000 is 0.75:1. It means that, 75% of its assets are financed by equity and the remaining 25% is financed by debt.
To learn more, try our - Equity ratio calculator
Interest Coverage Ratio
Financial metric used to measure, if a company can pay the interest it owes on the debt it has incurred.
In other words, it measures how many times a company can cover its current interest payment with its available earnings.
It is also called "Times interest earned".
Lender, investors and creditors often use this metric to determine a company's riskiness relative to its current debt or future borrowing.
A high interest coverage ratio may mean the company isn't fully utilizing its available capital and could possibly
generate additional sales by acquiring more debt to expand its production capacity, particularly if earnings have reached a
plateau with the company already producing at full capacity.
But a low interest coverage ratio may mean the company is at risk
of defaulting on its debt obligations, which is a bad sign for its level of earnings. When a company's interest coverage ratio
is 1.5 or lower, its ability to meet interest expense may be questionable.
Formula:
How to use this equation?
This is an income statement component; the values are commonly stated against EBIT and Interest Expense. To use this ratio, divide the EBIT by Interest expense.Earnings Before Interest & Tax (EBIT):
Profit before deducting all its interest & taxes.
Interest Expense:
Interest expense is the cost of debt - the amount paid for servicing the amount borrowed by the company.
Example:
Interest coverage ratio for a company with a net income of $100,000 and interest expense of $25,000 is 4 times. It can meet its interest payments 4 times of its earnings. Interest coverage ratio lower than 1.5 times means a company is vulnerable and may face difficulties to meet its interest payments.